
/
Use cases
Launch week #1: introducing analytics
Tonight we’re hosting our first MCP Connect San Francisco alongside Datadog, Mux, Twelve Labs, Daytona and MCP Jam, and we think that’s pretty cool.
But first things first. Let’s talk about how to evaluate and monitor your MCP servers!
Why?
It’s no secret that getting feedback on how an MCP server is working isn’t trivial.
On the one hand, MCP clients don’t pass along much information on what happens on the user side, and on the other hand, understanding what happens on the server side requires getting into the weeds of the protocol.
Lucky for you, we’ve tried to make life a little bit easier! Watch the video below and read on for more information!
How it works
Evaluating how an MCP server is behaving is a subject worthy of an entire blog series (which we’re working on right now). However, let’s at least cover the basics. When designing this first version of Alpic’s analytics, we set out to show you the most meaningful metrics possible: who your users are, what features of your server they are using the most, and where errors and inefficiencies are coming from.
For that we’ve exposed the following metrics:
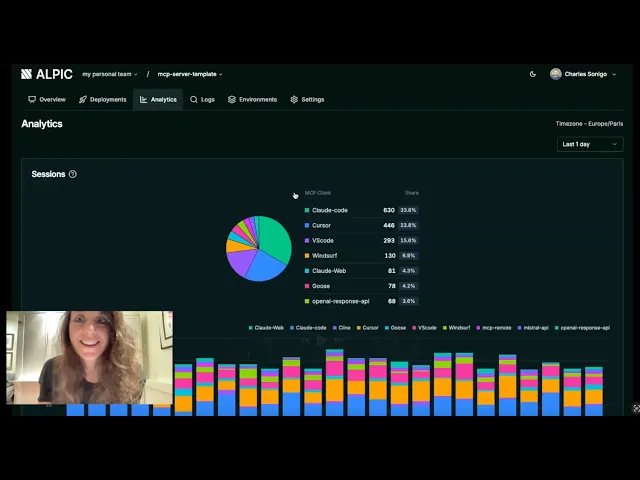
Sessions
Sessions shows the sum of all MCP initialization requests and breaks down the number of sessions per MCP client used. You can select a period of time to drill down or look at the trends over time.

Requests
Requests show the number of MCP requests received, broken down by MCP method in your server
“Tools” for example correspond to the various tools/call requests, prompts to prompts/get requests, and resources to resources/read requests. The “other” category is a catch all for protocol requests that indicate active usage of your server including initialize, tools/list, prompts/list, resources/list. Any other requests are filtered out as they do not reveal anything about the use of the server.

Output tokens
Alpic estimates the token equivalent of each part of the MCP response that is passed to the LLM context window, per MCP method you’re using. This helps gauge how well designed your server is, or if certain tasks are clogging the context window needlessly.

Request latency
We also calculate the average response time (in ms) of the requests hitting your server, another indication of the user experience and to help you track whether any issues emerged following recent deployments.

MCP Errors
MCP errors are errors originating in the MCP communication. They can be things like request timeouts, tools not found, internal server errors or protocol violations. As they are not passed to the LLM, they generally just appear as an error message to a user and require your attention.

Tool errors
Tool errors occur during tool execution. They take the form of a successful MCP JSON-RPC responses with isError: true in the result payload. These types of errors, on the other hand, are passed to to the LLM and can effectively be used as context and contain retry strategies if well designed (have a look at our article on how to do so here!)

What this means for developers
This first set of analytics (the first on the market, by the way!) aims to give you an overall understanding about how the MCP server is being used and how effectively LLMs are interacting with it. While MCP clients today don’t expose information such as the user prompt entered when the tool call is made, or whether or not the task was fully completed after the tool or resource was called, optimizing for tool calls, errors, token use, and latency is a great way to understand how well you designed your server and what’s being
Get Started
Head to the Analytics tab of your project to start tracking these insights. If you haven’t already, sign up at app.alpic.ai!
Liked what you read here?
Get our newsletter!